October-November 2018
Two Graphs Are Simpler Than One: A Cooling System Simulator
Live cooling-system sim for a PLC cybersecurity event. Splitting flow and heat into two graph passes kept it cheap and the behaviour believable.
Trying to solve flow and heat as a coupled system would have been a real CFD problem and I had two weeks. A cybersecurity event in late 2018 needed a cooling-system simulator that contestants could poke at through PLCs over a weekend, and the deadline shaped every decision after it: cheap to compute, plausible to a non-specialist, runs all weekend on one server. The useful design move was modelling flow and heat as two separate graph passes, not one combined PDE.
What the event needed
The challenge was about PLCs. Contestants would change setpoints, valves, or pump speeds, and we needed them to see whether their action made the plant stable, wasted coolant, or melted something. That meant:
- Multiple monitoring clients had to update from one simulation server in near real time.
- The system had to be configurable enough that the event organisers could ship me a new plant on Friday night and have it running Saturday morning.
- It had to be obvious. A simulator nobody understands isn’t a teaching tool, it’s noise.
The split that made it cheap
Instead of the coupled solver:
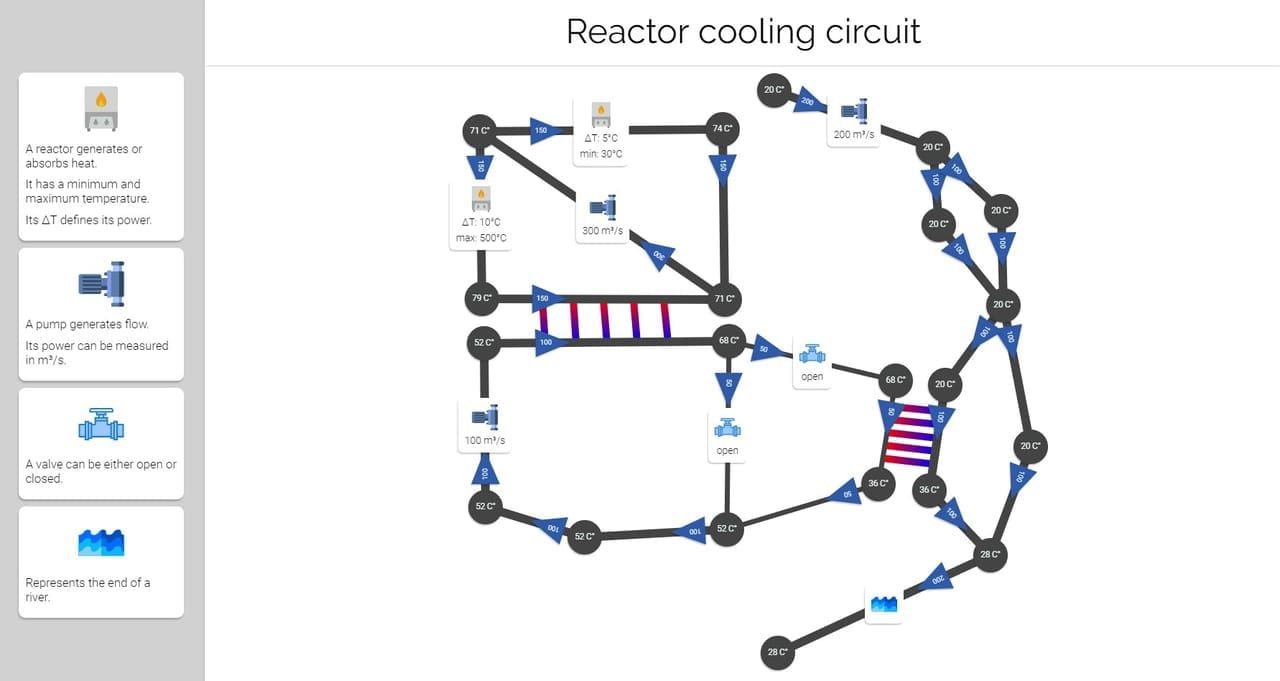
- Flow first, as graph traversal. Walk the pipe graph from the pumps, accumulate pressure, distribute water to nodes.
- Heat second, as a linear system. Build the adjacency matrix from the flow result, add boundary conditions (heaters, exchangers, base temperatures), solve for node temperatures with NumPy.
- Repeat both passes per tick.
This is wrong as physics. It’s right as a model. Flow doesn’t react to instantaneous heat in any way contestants could perceive, and the cost of solving them separately was a tiny fraction of solving them together. The clean phase boundary also meant when “the heat is weird,” I knew exactly which pass to look at.
Why the editor mattered
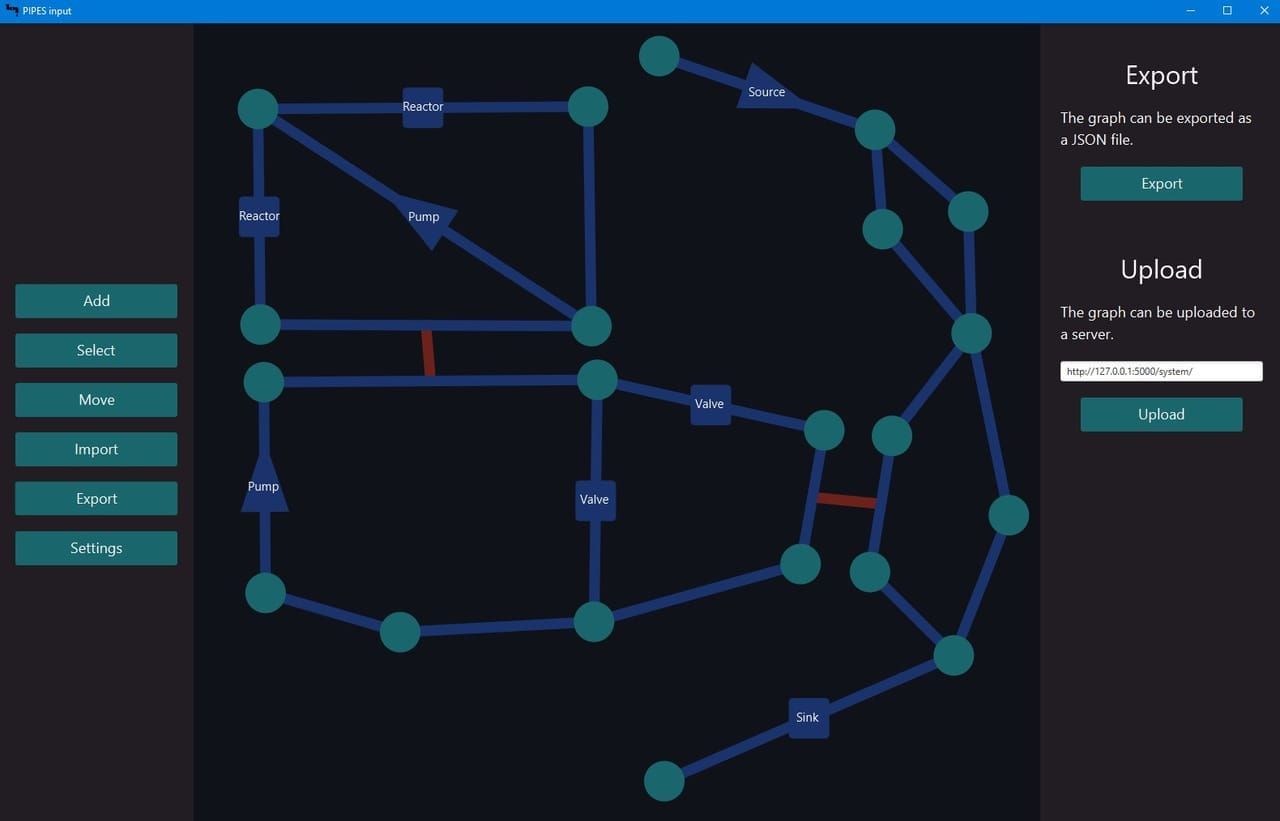
The simulator’s most-used UI was the input editor, a separate JavaFX tool where you laid out the plant, set parameters per element, and exported JSON the sim ate. I wrote up the editor’s own story here, because in hindsight it deserved to be its own project.
The lesson: a simulation is only as useful as its input pipeline. If editing the plant requires editing source, organisers won’t use it.
What I’d change
- State what the model claims. A convincing sim needs an honest README about what it does and doesn’t model. Mine didn’t. Anyone who took the numbers seriously could have walked away believing more than the model deserved.
- Recorded scenarios as regression tests. Sim projects drift in ways that look plausible on screen. Storing “this input over 60 seconds produces these outputs” would have caught me when I broke the temperature solver on Saturday morning at the event.
- Skip JavaFX. Cross-platform packaging was painful and the desktop dependency made the editor harder to hand off than it should have been. A web-based editor in the same browser the monitors used would have meant one fewer install for the organisers.
Related articles
-
An Obsidian Sync Built Around the Merger I Already Had
VaultLink: self-hosted Obsidian sync. Edit in any editor, online or off, then come back to a converged vault. The app that justified reconcile-text.

-
Backing Up Running Databases Without Stopping Them
A Bash container around BorgBackup. BTRFS snapshots give atomic consistency, numeric env vars give multi-target 3-2-1, the loop is sleep not cron.

-
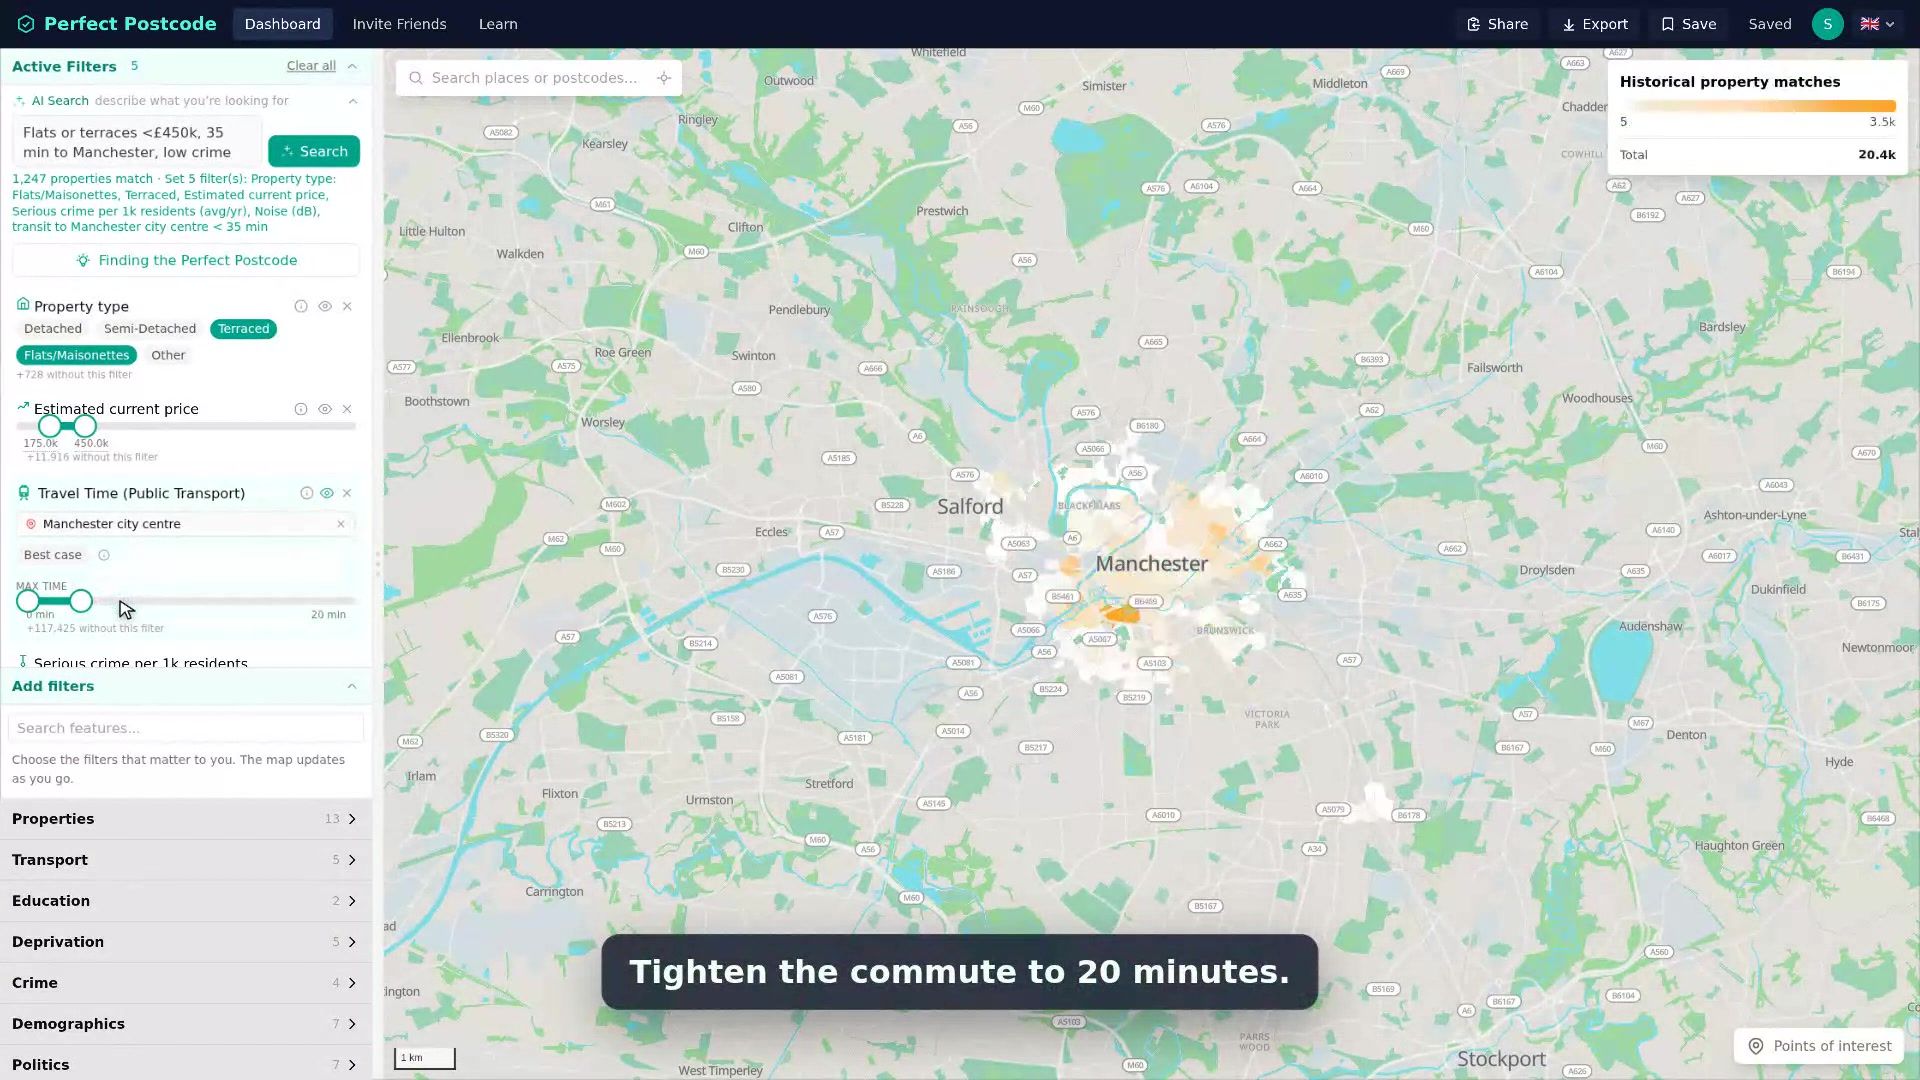
25 Million UK Property Rows in a Single Rust Process
Notes on perfect-postcode.co.uk. Every numeric feature is u16-quantised in a row-major array, so filter eval is two integer compares per row.